Monthly Average Rainy days in Nossa Senhora do Ó
The number of days each month with rain, snow and hail in Nossa Senhora do Ó (), Brazil.
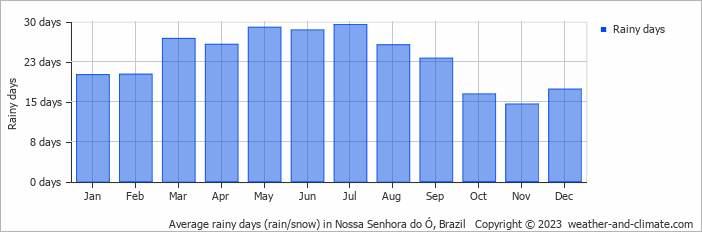
- Most rainy days are in January, February, March, April, May, June, July, August, September, October and December.
- On average, July is the most rainy with 29 days of rain/snow.
- On average, November is the driest month with 14 rainy days.
- The average annual number of rainy days is 276.
Current rainfall in Nossa Senhora do Ó
Thu Dec 12
32°C | 25°C
E  18 km/h
18 km/h0.8 mm
partly cloudy and rain
Fri Dec 13
32°C | 25°C
SE 18 km/h
18 km/h1.6 mm
partly cloudy and rain
Sat Dec 14
32°C | 25°C
SE 18 km/h
18 km/h5.3 mm
partly cloudy and rain