Average monthly rainy days in North Yunderup
The number of days each month with rain, snow and hail in North Yunderup (), Australia.
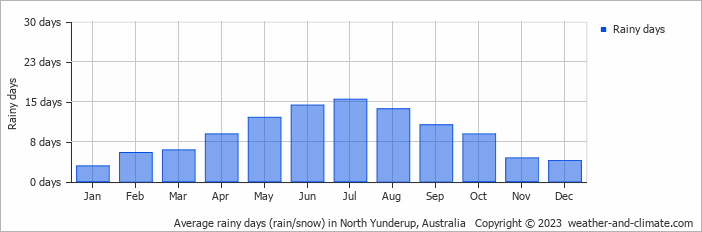
- Most rainy days are in July.
- On average, July is the most rainy with 15 days of rain/snow.
- On average, January is the driest month with 2 rainy days.
- The average annual number of rainy days is 106.
Forecast for North Yunderup
Sun May 05
20°C | 9°C
SW  18 km/h
18 km/h0.2 mm
partly cloudy and chance of slight rain
Mon May 06
21°C | 11°C
SE 11 km/h
11 km/hpartly cloudy and no rain
Tue May 07
25°C | 11°C
E 18 km/h
18 km/hclear and no rain


