ClimateForecastAprilMay >>

Average monthly rainy days in Morne-à-lʼEau

The number of days each month with rain, snow and hail in Morne-à-lʼEau (), Guadeloupe.

Average monthly rainy days in Morne-à-lʼEau,

Feel free to add this climate graph to your website. Click the copy button above.

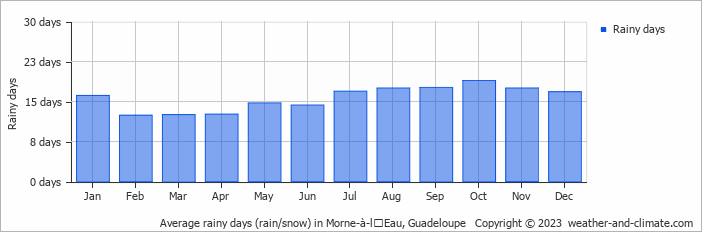
  • Most rainy days are in January, July, August, September, October, November and December.
  • On average, October is the most rainy with 18 days of rain/snow.
  • On average, February is the driest month with 12 rainy days.
  • The average annual number of rainy days is 188.

Weather Forecasts for Morne-à-lʼEau

Sat   Apr 20
31°C | 23°C
NE 11 km/h
2.1 mm
broken clouds and  chance of rain

broken clouds and chance of rain

Sun   Apr 21
31°C | 23°C
SE 14 km/h
3.6 mm
broken clouds and rain

broken clouds and rain

Mon   Apr 22
31°C | 23°C
E 18 km/h
1.6 mm
partly cloudy and  chance of rain

partly cloudy and chance of rain

Interested in more climate information?

Weather and Climate provides you with all the information you need about the climate in Morne-à-lʼEau.

Our site offers climate and forecast data for every country in the world. Are you going to Guadeloupe? On this website you can find historical weather averages for many cities in Guadeloupe. Not sure yet where to go? We now have a tool which recommends destinations that suit your ideal climate conditions. Find out where to go with our weather planner.