Monthly Average Rainy days in Miłków
The number of days each month with rain, snow and hail in Miłków (Lower Silesia), Poland.
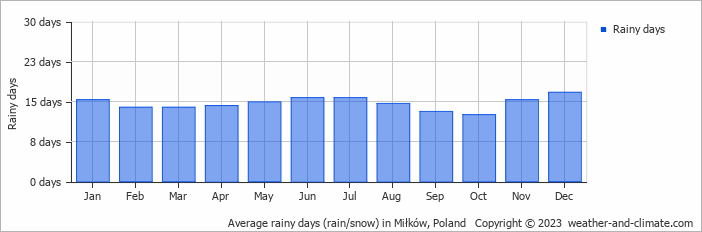
- Most rainy days are in January, June, July, November and December.
- On average, December is the most rainy with 16 days of rain/snow.
- On average, October is the driest month with 12 rainy days.
- The average annual number of rainy days is 175.
Current rainfall in Miłków
Sun Dec 22
7°C | 1°C
SW  5 m/s
5 m/s
5 m/s8.7 mm
broken clouds and rain
Mon Dec 23
2°C | -2°C
SW 2 m/s
2 m/s3.5 mm
broken clouds and small chance of rain
Tue Dec 24
1°C | -2°C
NW 4 m/s
4 m/s4.8 mm
overcast and chance of snow


