Monthly Average Rainy days in Milagro
The number of days each month with rain, snow and hail in Milagro (), Ecuador.
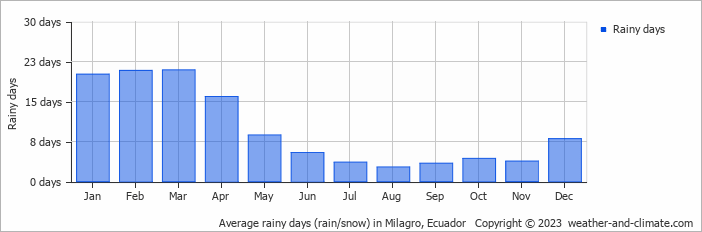
- Most rainy days are in January, February, March and April.
- On average, March is the most rainy with 20 days of rain/snow.
- On average, August is the driest month with 2 rainy days.
- The average annual number of rainy days is 117.
Current rainfall in Milagro
Thu Nov 21
33°C | 22°C
SW  18 km/h
18 km/hbroken clouds and no rain
Fri Nov 22
34°C | 22°C
SW 18 km/h
18 km/hpartly cloudy and no rain
Sat Nov 23
35°C | 22°C
SW 18 km/h
18 km/hbroken clouds and no rain


