Monthly Average Rainy days in Miajadas
The number of days each month with rain, snow and hail in Miajadas (Extremadura), Spain.
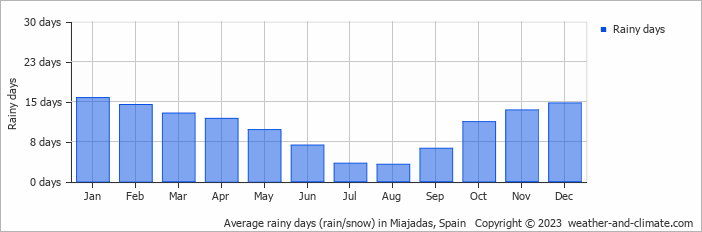
- Most rainy days are in January.
- On average, January is the most rainy with 15 days of rain/snow.
- On average, August is the driest month with 3 rainy days.
- The average annual number of rainy days is 123.
Current rainfall in Miajadas
Tue Dec 03
16°C | 8°C
W  11 km/h
11 km/hbroken clouds and no rain
Wed Dec 04
17°C | 8°C
W 11 km/h
11 km/halmost clear and no rain
Thu Dec 05
14°C | 7°C
SE 4 km/h
4 km/hbroken clouds and no rain


