Monthly Average Rainy days in Marcq-en-Baroeul
The number of days each month with rain, snow and hail in Marcq-en-Baroeul (Nord-Pas-de-Calais), France.
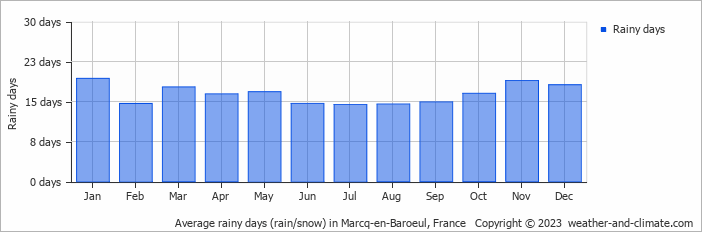
- Most rainy days are in January, March, April, May, October, November and December.
- On average, January is the most rainy with 19 days of rain/snow.
- On average, July is the driest month with 14 rainy days.
- The average annual number of rainy days is 196.
Current rainfall in Marcq-en-Baroeul
Sun Dec 22
10°C | 4°C
W  8 m/s
8 m/s
8 m/s2.4 mm
partly cloudy and chance of slight rain
Mon Dec 23
7°C | 2°C
NW 8 m/s
8 m/s0.4 mm
partly cloudy and chance of slight rain
Tue Dec 24
7°C | 3°C
S 4 m/s
4 m/sovercast and no rain