Monthly Average Rainy days in Manglaralto
The number of days each month with rain, snow and hail in Manglaralto (), Ecuador.
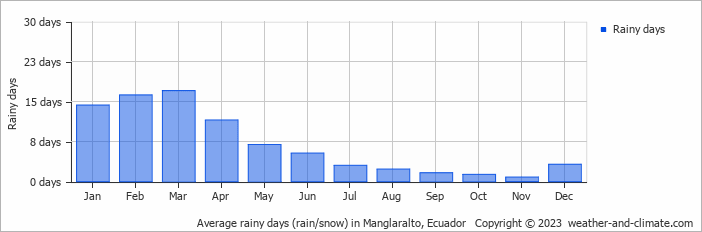
- Most rainy days are in February and March.
- Manglaralto has dry periods in September, October and November.
- On average, March is the most rainy with 17 days of rain/snow.
- On average, November is the driest month with 0 rainy days.
- The average annual number of rainy days is 83.
Current rainfall in Manglaralto
Wed Jan 15
29°C | 24°C
W  4 m/s
4 m/s
4 m/s0.6 mm
partly cloudy and chance of slight rain
Thu Jan 16
29°C | 24°C
W 5 m/s
5 m/sbroken clouds and no rain
Fri Jan 17
30°C | 24°C
W 5 m/s
5 m/s0.6 mm
broken clouds and chance of slight rain


