Monthly Average Rainy days in Manacapuru
The number of days each month with rain, snow and hail in Manacapuru (), Brazil.
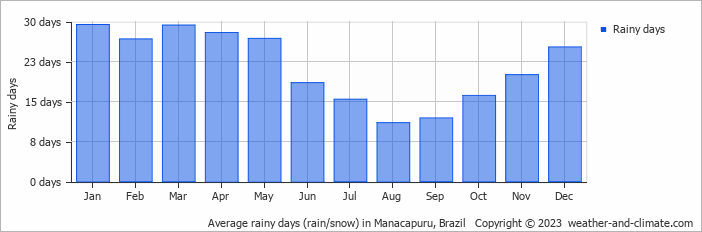
- Most rainy days are in January, February, March, April, May, June, July, October, November and December.
- On average, January is the most rainy with 29 days of rain/snow.
- On average, August is the driest month with 11 rainy days.
- The average annual number of rainy days is 258.
Current rainfall in Manacapuru
Wed Dec 11
29°C | 24°C
NE  14 km/h
14 km/h5.4 mm
broken clouds and thunder
Thu Dec 12
28°C | 24°C
NE 11 km/h
11 km/h10 mm
broken clouds and thunder
Fri Dec 13
32°C | 24°C
E 7 km/h
7 km/h2.9 mm
broken clouds and thunder