Average monthly rainy days in Lyngværet
The number of days each month with rain, snow and hail in Lyngværet (), Norway.
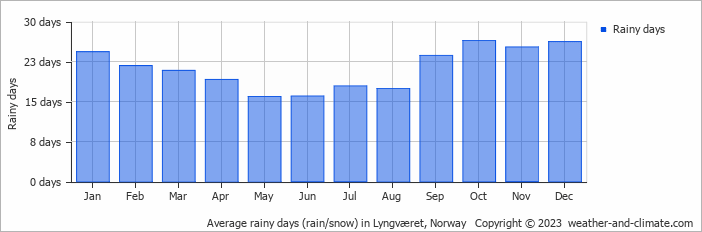
- Most rainy days are in January, February, March, April, May, June, July, August, September, October, November and December.
- On average, October is the most rainy with 26 days of rain/snow.
- On average, May is the driest month with 15 rainy days.
- The average annual number of rainy days is 254.
Forecast for Lyngværet
Wed May 08
7°C | 3°C
S  22 km/h
22 km/h1.3 mm
overcast and rain
Thu May 09
7°C | 2°C
NW 29 km/h
29 km/h13 mm
overcast and heavy rain
Fri May 10
7°C | 2°C
NW 22 km/h
22 km/h1.3 mm
partly cloudy and rain