Average Rainy - Precipitation days in Laval
Over the course of the year, Laval experiences 807 mm of rain/snow across 171 days. On this page you will discover more about the number of precipitation days.
Monthly Distribution of Rainy Days
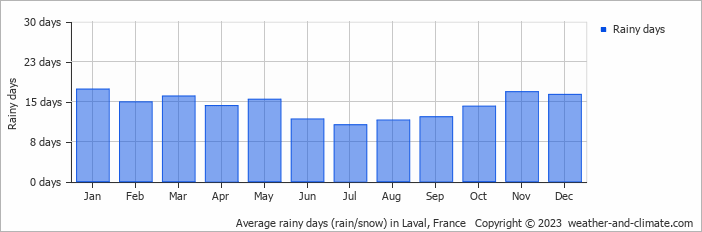
December is usually the wettest with 85 mm of rain over 16 rainy days, whereas July averages 52 mm during its 11 rainy days.
Amsterdam Precipitation Days Compared World Wide
On average, Laval receives over 171 days of precipitation annually. For comparison, here is some data from popular tourist destinations around the world:In Riyadh, Saudi Arabia, there are about 29 precipitation days annually, reflecting its dry desert environment.
Singapore, Singapore, records about 175 precipitation days per year, with rain spread fairly evenly throughout the year.
In Barcelona, Spain, there are approximately 121 precipitation days per year, evenly distributed across the year with no extreme wet or dry seasons.
Chicago, USA, has 133 precipitation days annually, with a mix of rain and snow.
In Seoul, South Korea, the city experiences 106 precipitation days annually, with most rain falling during the summer monsoon season.
Perth, Australia, sees approximately 103 precipitation days annually, mostly during the winter months.
Rain Facts From Around the Globe
Here are some amazing facts about rain and precipitation worldwide:
- Cherrapunji, India, records an average of 322 rainy days each year. Despite this, the wettest place is Mount Waialeale in Hawaii with 11500 mm annual rainfall.
- The fastest recorded raindrop fell at 18 meters per second during a thunderstorm in Brazil.
- The Atacama Desert in Chile is so dry that some weather stations have never recorded rainfall since their installation.
- The largest recorded raindrop measured 8.8 mm in diameter during a tropical storm on La Réunion Island.
- Some clouds can weigh up to 500,000 tons, that's equivalent to the weight of 100 elephants.
For more detailed information about rainfall patterns in Laval, visit our Rainfall & Precipitation page.
Current rainfall in Laval