Monthly Average Rainy days in Las Peñas
The number of days each month with rain, snow and hail in Las Peñas (), Ecuador.
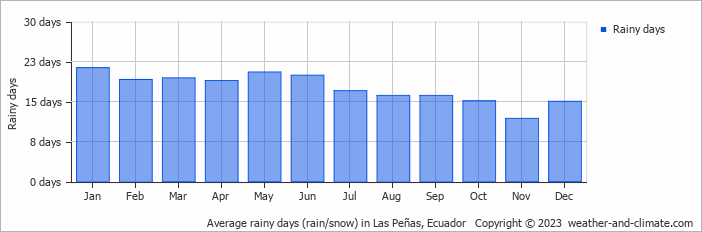
- Most rainy days are in January, February, March, April, May, June, July, August, September, October and December.
- On average, January is the most rainy with 21 days of rain/snow.
- On average, November is the driest month with 11 rainy days.
- The average annual number of rainy days is 210.
Current rainfall in Las Peñas
Sun Jan 05
28°C | 23°C
NW  4 m/s
4 m/s
4 m/sbroken clouds and no rain
Mon Jan 06
29°C | 24°C
NW 6 m/s
6 m/s1 mm
broken clouds and slight rain
Tue Jan 07
28°C | 24°C
W 3 m/s
3 m/s18 mm
overcast and thunder


