Average Rainy - Precipitation days in La Victoria
La Victoria sees 80 days of precipitation annually, totaling to 2849 mm of rain. Learn more about it on this page.
Monthly Distribution of Rainy Days
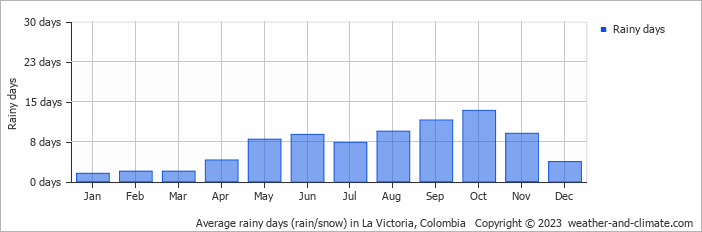
The wettest month is October, with 13 rainy days bringing 380 mm of rain. In contrast, January sees 2 rainy days with 54 mm of rain.
Amsterdam Precipitation Days Compared World Wide
On average, La Victoria receives over 80 days of precipitation annually. For comparison, here is some data from popular tourist destinations around the world:In Riyadh, Saudi Arabia, there are about 29 precipitation days annually, reflecting its dry desert environment.
Singapore, Singapore, records about 175 precipitation days per year, with rain spread fairly evenly throughout the year.
In Athens, Greece, it rains around 70 days in the year; therefore, it is one of the driest Mediterranean cities, mainly dominated by winter rainfall.
Chicago, USA, has 133 precipitation days annually, with a mix of rain and snow.
Osaka, Japan, experiences 198 precipitation days annually, with wetter summers compared to winter.
In Tokyo, Japan, the city sees around 181 precipitation days annually, with significant summer rains due to typhoon season.
Rain Facts From Around the Globe
Let’s explore more fascinating precipitation records:
- Tutunendo, Colombia, gets about 340 days of rain every year, which arguably makes it the wettest place in the world.
- On Réunion Island, a tropical cyclone generated 1825 mm in just 24 hours.
- Singapore receives thunder on 167 days in the year and is considered one of the most thunderous cities in the world.
- The smallest drops that fall are called drizzle drops, and they have a diameter of 0.5 mm.
- Some heavy storms generate "diamond dust," which consists of very small ice crystals that float in the air.
For more detailed information about rainfall patterns in La Victoria, visit our Rainfall & Precipitation page.
Current rainfall in La Victoria


