ClimateForecastAprilMay >>

Average monthly rainy days in La Herradura

The number of days each month with rain, snow and hail in La Herradura (), El Salvador.

Average monthly rainy days in La Herradura,

Feel free to add this climate graph to your website. Click the copy button above.

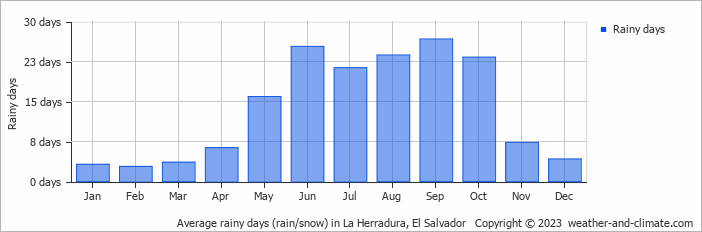
  • Most rainy days are in May, June, July, August, September and October.
  • On average, September is the most rainy with 26 days of rain/snow.
  • On average, February is the driest month with 2 rainy days.
  • The average annual number of rainy days is 163.

Weather Forecasts for La Herradura

Thu   Apr 18
34°C | 25°C
S 14 km/h
4 mm
partly cloudy and rain

partly cloudy and rain

Fri   Apr 19
34°C | 25°C
SE 18 km/h
2.8 mm
partly cloudy and thunder

partly cloudy and thunder

Sat   Apr 20
34°C | 25°C
S 14 km/h
1.3 mm
partly cloudy and thunder

partly cloudy and thunder

Interested in more climate information?

Weather and Climate provides you with all the information you need about the climate in La Herradura.

Our site offers climate and forecast data for every country in the world. Are you going to El Salvador? On this website you can find historical weather averages for many cities in El Salvador. Not sure yet where to go? We now have a tool which recommends destinations that suit your ideal climate conditions. Find out where to go with our weather planner.