ClimateForecastMayJune >>

Average monthly rainy days in La Calzada de Calatrava

The number of days each month with rain, snow and hail in La Calzada de Calatrava (Castilla-La Mancha), Spain.

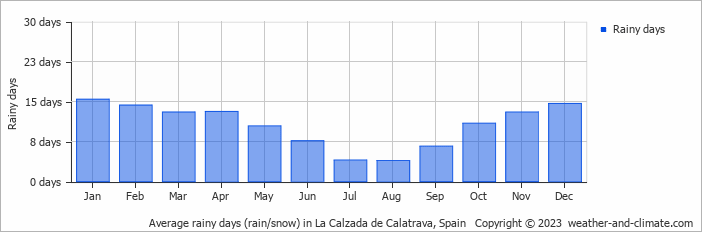
  • Most rainy days are in January.
  • On average, January is the most rainy with 15 days of rain/snow.
  • On average, August is the driest month with 3 rainy days.
  • The average annual number of rainy days is 126.

Forecast for La Calzada de Calatrava

Wed   May 15
21°C | 7°C
W 18 km/h
almost clear and no rain

almost clear and no rain

Thu   May 16
20°C | 7°C
W 22 km/h
partly cloudy and no rain

partly cloudy and no rain

Fri   May 17
22°C | 9°C
SW 14 km/h
0.2 mm
partly cloudy and  chance of slight rain

partly cloudy and chance of slight rain

Interested in more climate information?

This site provides you with all the information you need about the climate in La Calzada de Calatrava.

Our site offers climate and forecast data for every country in the world. Are you going to Spain? On this website you can find historical weather averages for many cities in Spain. Not sure yet where to go? We now have a tool which recommends destinations that suit your ideal climate conditions. Find out where to go with our weather planner.