Monthly Average Rainy days in Kumara
The number of days each month with rain, snow and hail in Kumara (West Coast), New Zealand.
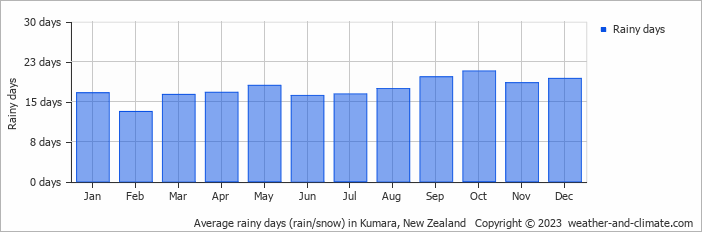
- Most rainy days are in January, March, April, May, June, July, August, September, October, November and December.
- On average, October is the most rainy with 20 days of rain/snow.
- On average, February is the driest month with 13 rainy days.
- The average annual number of rainy days is 208.
Current rainfall in Kumara
Sun Jan 12
23°C | 9°C
W  5 m/s
5 m/s
5 m/salmost clear and no rain
Mon Jan 13
22°C | 10°C
W 5 m/s
5 m/sbroken clouds and no rain
Tue Jan 14
21°C | 13°C
W 4 m/s
4 m/s0.5 mm
broken clouds and chance of slight rain