Monthly Average Rainy days in Kubang
The number of days each month with rain, snow and hail in Kubang (), Indonesia.
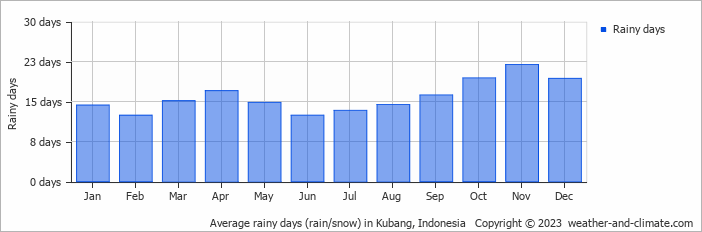
- Most rainy days are in March, April, September, October, November and December.
- On average, November is the most rainy with 21 days of rain/snow.
- On average, February is the driest month with 12 rainy days.
- The average annual number of rainy days is 190.
Current rainfall in Kubang
Tue Jan 28
30°C | 24°C
N  4 m/s
4 m/s
4 m/s18 mm
overcast and thunder
Wed Jan 29
29°C | 23°C
N 3 m/s
3 m/s0.8 mm
broken clouds and chance of rain
Thu Jan 30
30°C | 22°C
NE 3 m/s
3 m/s0.4 mm
partly cloudy and slight rain


