Average Rainy - Precipitation days in Guachaca
Guachaca sees 70 days of precipitation annually, totaling to 2332 mm of rain. Learn more about it on this page.
Monthly Distribution of Rainy Days
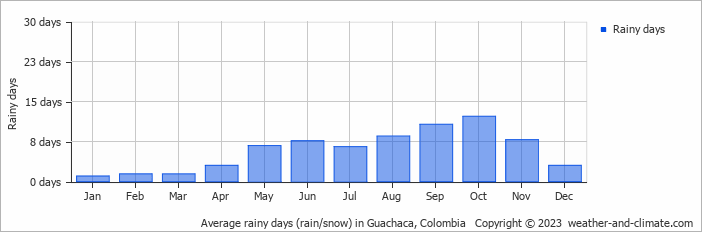
October is usually the wettest with 341 mm of rain over 12 rainy days, whereas January averages 31 mm during its a single rainy day.
Amsterdam Precipitation Days Compared World Wide
Guachaca's average annual precipitation falls over 70 days. Let's compare this to some popular worldwide tourist destinations:
In Cairo, Egypt, there are only about 16 precipitation days annually, making it one of the driest capitals in the world.
In Kuala Lumpur, Malaysia, the city experiences around 212 precipitation days annually, consistent with its tropical rainforest climate.
The city of Rome, Italy, averages 131 precipitation days annually, spread fairly evenly throughout the year.
Boston, USA, experiences 134 precipitation days annually, including significant snow during winter.
In Seoul, South Korea, the city experiences 106 precipitation days annually, with most rain falling during the summer monsoon season.
In Brisbane, Australia, the city averages 123 precipitation days per year, making it wetter than Sydney.
Rain Facts From Around the Globe
Here are some amazing facts about rain and precipitation worldwide:
- Cherrapunji, India, records an average of 322 rainy days each year. Despite this, the wettest place is Mount Waialeale in Hawaii with 11500 mm annual rainfall.
- The fastest recorded raindrop fell at 18 meters per second during a thunderstorm in Brazil.
- The Atacama Desert in Chile is so dry that some weather stations have never recorded rainfall since their installation.
- The largest recorded raindrop measured 8.8 mm in diameter during a tropical storm on La Réunion Island.
- Some clouds can weigh up to 500,000 tons, that's equivalent to the weight of 100 elephants.
For more detailed information about rainfall patterns in Guachaca, visit our Rainfall & Precipitation page.
Current rainfall in Guachaca


