Monthly Average Rainy days in Greytown
The number of days each month with rain, snow and hail in Greytown (Wellington), New Zealand.
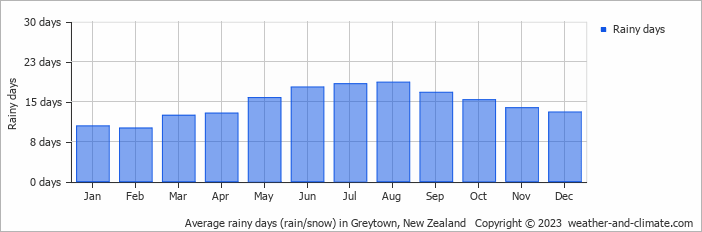
- Most rainy days are in May, June, July, August, September and October.
- On average, August is the most rainy with 18 days of rain/snow.
- On average, February is the driest month with 10 rainy days.
- The average annual number of rainy days is 174.
Current rainfall in Greytown
Sun Jan 12
15°C | 9°C
SW  8 m/s
8 m/s
8 m/s3.7 mm
overcast and rain
Mon Jan 13
17°C | 9°C
SW 7 m/s
7 m/s1 mm
broken clouds and rain
Tue Jan 14
19°C | 9°C
SW 6 m/s
6 m/salmost clear and no rain