Monthly Average Rainy days in Grenivík
The number of days each month with rain, snow and hail in Grenivík (North Iceland), Iceland.
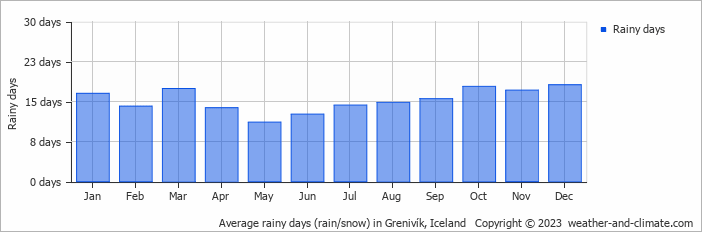
- Most rainy days are in January, March, September, October, November and December.
- On average, December is the most rainy with 18 days of rain/snow.
- On average, May is the driest month with 11 rainy days.
- The average annual number of rainy days is 183.
Current rainfall in Grenivík
Wed Jan 15
10°C | 6°C
S  5 m/s
5 m/s
5 m/s0.3 mm
broken clouds and slight rain
Thu Jan 16
8°C | -1°C
SE 3 m/s
3 m/s7.4 mm
overcast and heavy rain
Fri Jan 17
0°C | -7°C
N 3 m/s
3 m/s8 mm
overcast and snow


