ClimateForecastAprilMay >>

Average monthly rainy days in Girardot

The number of days each month with rain, snow and hail in Girardot (Cundinamarca), Colombia.

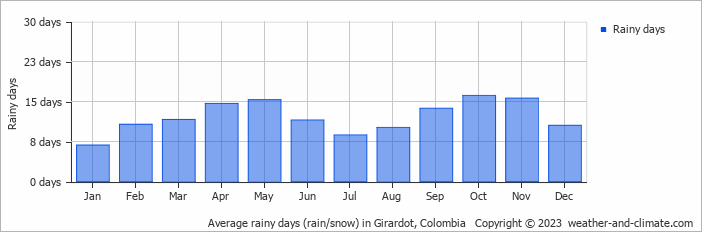
  • Most rainy days are in May, October and November.
  • On average, October is the most rainy with 16 days of rain/snow.
  • On average, January is the driest month with 6 rainy days.
  • The average annual number of rainy days is 145.

Weather Forecasts for Girardot

Wed   Apr 24
32°C | 24°C
S 11 km/h
5.2 mm
broken clouds and  chance of rain

broken clouds and chance of rain

Thu   Apr 25
32°C | 24°C
S 7 km/h
1.9 mm
partly cloudy and  chance of slight rain

partly cloudy and chance of slight rain

Fri   Apr 26
32°C | 24°C
S 7 km/h
11 mm
partly cloudy and thunder

partly cloudy and thunder

Interested in more climate information?

Weather and Climate provides you with all the information you need about the climate in Girardot.

Our site offers climate and forecast data for every country in the world. Are you going to Colombia? On this website you can find historical weather averages for many cities in Colombia. Not sure yet where to go? We now have a tool which recommends destinations that suit your ideal climate conditions. Find out where to go with our weather planner.