ClimateForecastMayJune >>

Average monthly rainy days in Garafía

The number of days each month with rain, snow and hail in Garafía (Canary Islands), Spain.

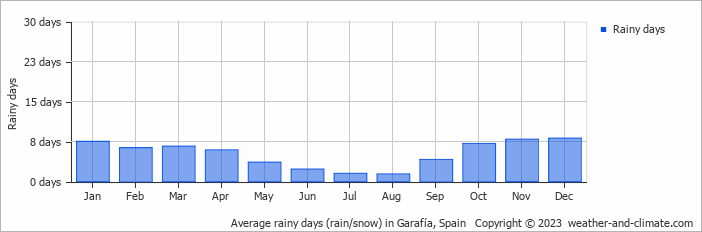
  • Garafía has dry periods in July and August.
  • On average, December is the most rainy with 8 days of rain/snow.
  • On average, August is the driest month with 1 rainy day.
  • The average annual number of rainy days is 62.

Forecast for Garafía

Wed   May 15
20°C | 14°C
NE 25 km/h
0.9 mm
broken clouds and small chance of slight rain

broken clouds and small chance of slight rain

Thu   May 16
21°C | 14°C
NE 22 km/h
1.5 mm
partly cloudy and small chance of rain

partly cloudy and small chance of rain

Fri   May 17
20°C | 14°C
NE 18 km/h
4.7 mm
overcast and heavy rain

overcast and heavy rain

Interested in more climate information?

This site provides you with all the information you need about the climate in Garafía.

Our site offers climate and forecast data for every country in the world. Are you going to Spain? On this website you can find historical weather averages for many cities in Spain. Not sure yet where to go? We now have a tool which recommends destinations that suit your ideal climate conditions. Find out where to go with our weather planner.