Average monthly rainy days in Galindo
The number of days each month with rain, snow and hail in Galindo (Querétaro), Mexico.
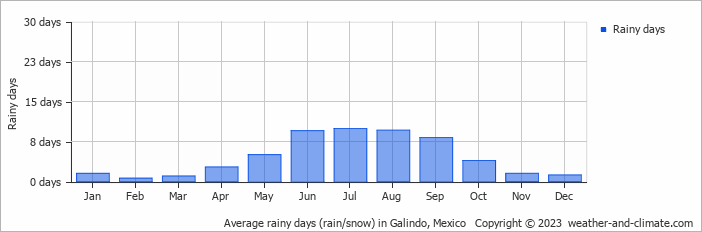
- Galindo has dry periods in January, February, March, November and December.
- On average, July is the most rainy with 9 days of rain/snow.
- On average, February is the driest month with 0 rainy days.
- The average annual number of rainy days is 54.
Forecast for Galindo
Tue May 07
34°C | 16°C
NW  14 km/h
14 km/hbroken clouds and no rain
Wed May 08
34°C | 18°C
NW 11 km/h
11 km/hbroken clouds and no rain
Thu May 09
35°C | 16°C
NE 22 km/h
22 km/hpartly cloudy and no rain


