Average monthly rainy days in Costa da Caparica

The number of days each month with rain, snow and hail in Costa da Caparica (Lisbon Region), Portugal.

Average monthly rainy days in Costa da Caparica,

Feel free to add this climate graph to your website. Click the copy button above.

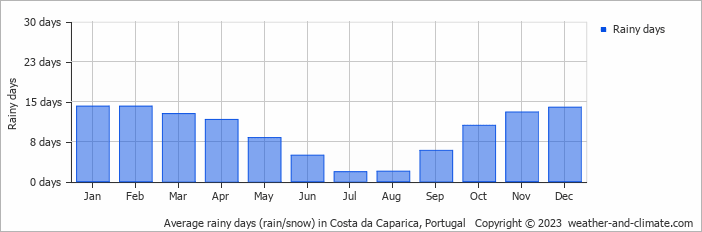
  • Costa da Caparica has dry periods in July and August.
  • On average, January is the most rainy with 14 days of rain/snow.
  • On average, July is the driest month with 1 rainy day.
  • The average annual number of rainy days is 112.

Weather Forecasts for Costa da Caparica

Fri   Mar 29
15°C | 9°C
SW 25 km/h
12 mm
broken clouds and thunder

broken clouds and thunder

Sat   Mar 30
14°C | 8°C
SW 32 km/h
8.8 mm
broken clouds and rain

broken clouds and rain

Sun   Mar 31
16°C | 9°C
W 29 km/h
3.7 mm
partly cloudy and rain

partly cloudy and rain

Interested in more climate information?

Weather and Climate provides you with all the information you need about the climate in Costa da Caparica.

Our site offers climate and forecast data for every country in the world. Are you going to Portugal? On this website you can find historical weather averages for many cities in Portugal. Not sure yet where to go? We now have a tool which recommends destinations that suit your ideal climate conditions. Find out where to go with our weather planner.