Average Rainy - Precipitation days in Corbara
Corbara sees 117 days of precipitation annually, totaling to 712 mm of rain. Learn more about it on this page.
Monthly Distribution of Rainy Days
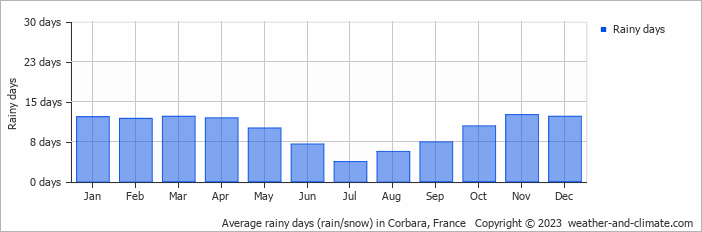
The wettest month is November, with 13 rainy days bringing 109 mm of rain. In contrast, July sees 4 rainy days with 15 mm of rain.
Amsterdam Precipitation Days Compared World Wide
On average, Corbara receives over 117 days of precipitation annually. For comparison, here is some data from popular tourist destinations around the world:In Riyadh, Saudi Arabia, there are about 29 precipitation days annually, reflecting its dry desert environment.
In Bogotá, Colombia, there are around 188 precipitation days annually, typical for its high-altitude tropical climate.
Seville, Spain, experiences 103 precipitation days annually, with wet winters and dry summers typical of southern Spain.
Boston, USA, experiences 134 precipitation days annually, including significant snow during winter.
Beijing, China, averages 72 precipitation days annually, concentrated in the summer months.
Adelaide, Australia, records about 86 precipitation days per year, with dry summers and wet winters.
Rain Facts From Around the Globe
Let’s explore more fascinating precipitation records:
- Tutunendo, Colombia, gets about 340 days of rain every year, which arguably makes it the wettest place in the world.
- On Réunion Island, a tropical cyclone generated 1825 mm in just 24 hours.
- Singapore receives thunder on 167 days in the year and is considered one of the most thunderous cities in the world.
- The smallest drops that fall are called drizzle drops, and they have a diameter of 0.5 mm.
- Some heavy storms generate "diamond dust," which consists of very small ice crystals that float in the air.
For more detailed information about rainfall patterns in Corbara, visit our Rainfall & Precipitation page.
Current rainfall in Corbara