Monthly Average Rainy days in Charters Towers
The number of days each month with rain, snow and hail in Charters Towers (Queensland), Australia.
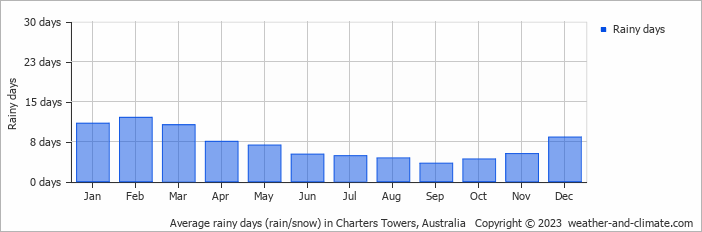
- On average, February is the most rainy with 12 days of rain/snow.
- On average, September is the driest month with 3 rainy days.
- The average annual number of rainy days is 83.
Current rainfall in Charters Towers
Mon Jan 13
38°C | 21°C
W  3 m/s
3 m/s
3 m/s5.3 mm
almost clear and no rain
Tue Jan 14
37°C | 24°C
NW 2 m/s
2 m/s0.2 mm
partly cloudy and chance of slight rain
Wed Jan 15
36°C | 23°C
NW 3 m/s
3 m/s3.1 mm
partly cloudy and thunder


