ClimateForecastMayJune >>

Average monthly rainy days in Chajarí

The number of days each month with rain, snow and hail in Chajarí (), Argentina.

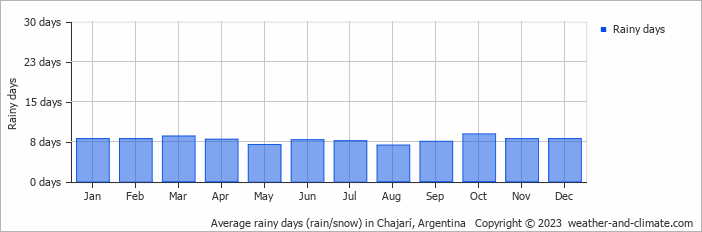
  • On average, October is the most rainy with 8 days of rain/snow.
  • On average, August is the driest month with 6 rainy days.
  • The average annual number of rainy days is 93.

Forecast for Chajarí

Sun   May 05
24°C | 18°C
NW 22 km/h
1.5 mm
overcast and  chance of slight rain

overcast and chance of slight rain

Mon   May 06
27°C | 20°C
SE 14 km/h
20 mm
broken clouds and thunder

broken clouds and thunder

Tue   May 07
26°C | 20°C
NW 18 km/h
26 mm
broken clouds and thunder

broken clouds and thunder

Interested in more climate information?

This site provides you with all the information you need about the climate in Chajarí.

Our site offers climate and forecast data for every country in the world. Are you going to Argentina? On this website you can find historical weather averages for many cities in Argentina. Not sure yet where to go? We now have a tool which recommends destinations that suit your ideal climate conditions. Find out where to go with our weather planner.