Monthly Average Rainy days in Celorio
The number of days each month with rain, snow and hail in Celorio (Asturias), Spain.
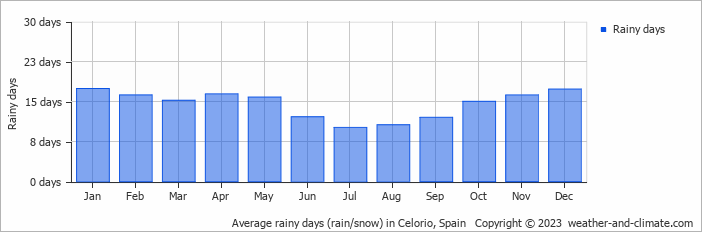
- Most rainy days are in January, February, March, April, May, October, November and December.
- On average, January is the most rainy with 17 days of rain/snow.
- On average, July is the driest month with 10 rainy days.
- The average annual number of rainy days is 174.
Current rainfall in Celorio
Tue Jan 07
15°C | 9°C
S  3 m/s
3 m/s
3 m/s1.7 mm
broken clouds and rain
Wed Jan 08
17°C | 11°C
SW 2 m/s
2 m/s0.7 mm
broken clouds and rain
Thu Jan 09
17°C | 10°C
W 7 m/s
7 m/sbroken clouds and no rain


