Monthly Average Rainy days in Cartí Yantupo
The number of days each month with rain, snow and hail in Cartí Yantupo (), Panama.
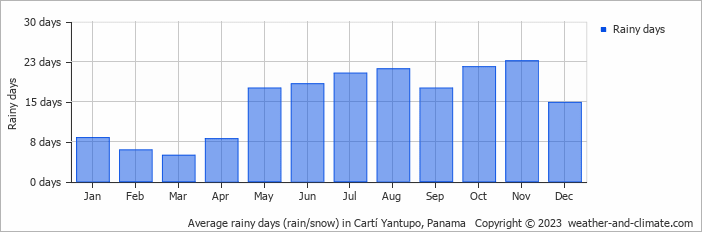
- Most rainy days are in May, June, July, August, September, October and November.
- On average, November is the most rainy with 22 days of rain/snow.
- On average, March is the driest month with 4 rainy days.
- The average annual number of rainy days is 180.
Current rainfall in Cartí Yantupo
Mon Jan 13
29°C | 23°C
N  6 m/s
6 m/s
6 m/s3.9 mm
broken clouds and chance of rain
Tue Jan 14
29°C | 22°C
NE 7 m/s
7 m/s8.5 mm
partly cloudy and chance of rain
Wed Jan 15
27°C | 21°C
NE 7 m/s
7 m/s12 mm
overcast and heavy rain