ClimateForecastMayJune >>

Average monthly rainy days in Cartertown

The number of days each month with rain, snow and hail in Cartertown (), the United States of America.

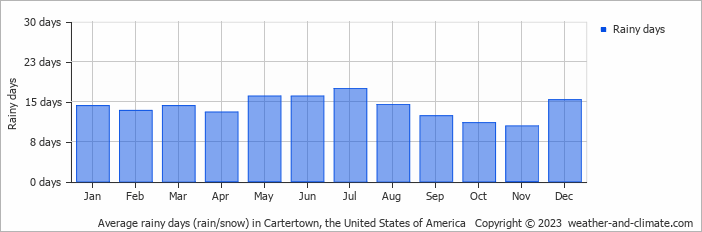
  • Most rainy days are in May, June, July and December.
  • On average, July is the most rainy with 17 days of rain/snow.
  • On average, November is the driest month with 10 rainy days.
  • The average annual number of rainy days is 167.

Weather Forecasts for Cartertown

Fri   May 03
23°C | 15°C
S 7 km/h
5.3 mm
broken clouds and rain

broken clouds and rain

Sat   May 04
23°C | 15°C
S 7 km/h
21 mm
broken clouds and thunder

broken clouds and thunder

Sun   May 05
24°C | 15°C
NW 11 km/h
2.1 mm
broken clouds and rain

broken clouds and rain

Interested in more climate information?

Weather and Climate provides you with all the information you need about the climate in Cartertown.

Our site offers climate and forecast data for every country in the world. Are you going to the United States of America? On this website you can find historical weather averages for many cities in the United States of America. Not sure yet where to go? We now have a tool which recommends destinations that suit your ideal climate conditions. Find out where to go with our weather planner.