Monthly Average Rainy days in Carterton
The number of days each month with rain, snow and hail in Carterton (Wellington), New Zealand.
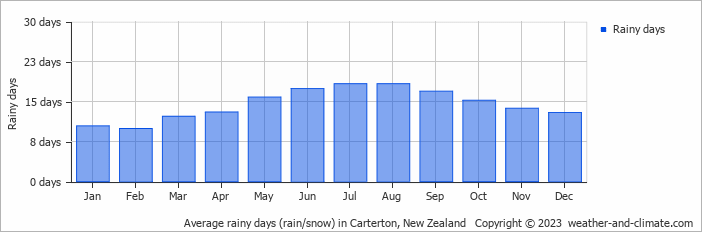
- Most rainy days are in May, June, July, August, September and October.
- On average, August is the most rainy with 18 days of rain/snow.
- On average, February is the driest month with 9 rainy days.
- The average annual number of rainy days is 174.
Current rainfall in Carterton
Wed Dec 04
25°C | 18°C
NW  18 km/h
18 km/h0.6 mm
overcast and chance of slight rain
Thu Dec 05
23°C | 13°C
NW 29 km/h
29 km/h2.9 mm
broken clouds and rain
Fri Dec 06
22°C | 10°C
SW 22 km/h
22 km/halmost clear and no rain