ClimateForecastMayJune >>

Average monthly rainy days in Caria

The number of days each month with rain, snow and hail in Caria (), Portugal.

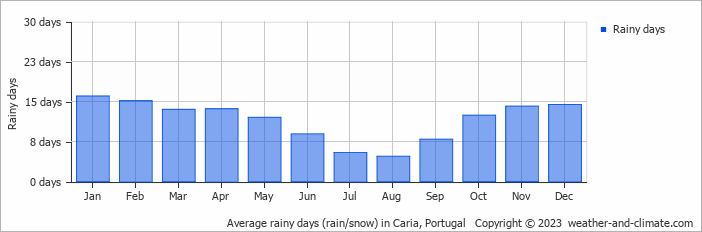
  • Most rainy days are in January and February.
  • On average, January is the most rainy with 16 days of rain/snow.
  • On average, August is the driest month with 4 rainy days.
  • The average annual number of rainy days is 138.

Forecast for Caria

Sat   May 04
18°C | 7°C
SW 22 km/h
0.4 mm
broken clouds and  chance of slight rain

broken clouds and chance of slight rain

Sun   May 05
16°C | 10°C
SW 18 km/h
7.1 mm
broken clouds and thunder

broken clouds and thunder

Mon   May 06
20°C | 6°C
NW 14 km/h
almost clear and no rain

almost clear and no rain

Interested in more climate information?

This site provides you with all the information you need about the climate in Caria.

Our site offers climate and forecast data for every country in the world. Are you going to Portugal? On this website you can find historical weather averages for many cities in Portugal. Not sure yet where to go? We now have a tool which recommends destinations that suit your ideal climate conditions. Find out where to go with our weather planner.