Average Rainy - Precipitation days in Capilla del Monte
Capilla del Monte sees 82 days of precipitation annually, totaling to 927 mm of rain. Learn more about it on this page.
Monthly Distribution of Rainy Days
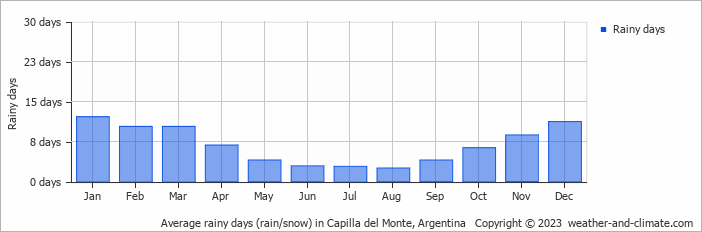
January is usually the wettest with 138 mm of rain over 12 rainy days, whereas July averages 15 mm during its 3 rainy days.
Amsterdam Precipitation Days Compared World Wide
On average, Capilla del Monte receives over 82 days of precipitation annually. For comparison, here is some data from popular tourist destinations around the world:Las Vegas, USA, gets about 26 precipitation days annually, which is typical for its arid desert climate.
In Bogotá, Colombia, there are around 188 precipitation days annually, typical for its high-altitude tropical climate.
In Barcelona, Spain, there are approximately 121 precipitation days per year, evenly distributed across the year with no extreme wet or dry seasons.
Every year, the city of New York, USA, records about 130 precipitation days, with rainfall evenly distributed throughout the year.
Beijing, China, averages 72 precipitation days annually, concentrated in the summer months.
In Brisbane, Australia, the city averages 123 precipitation days per year, making it wetter than Sydney.
Rain Facts From Around the Globe
Let’s explore more fascinating precipitation records:
- Tutunendo, Colombia, gets about 340 days of rain every year, which arguably makes it the wettest place in the world.
- On Réunion Island, a tropical cyclone generated 1825 mm in just 24 hours.
- Singapore receives thunder on 167 days in the year and is considered one of the most thunderous cities in the world.
- The smallest drops that fall are called drizzle drops, and they have a diameter of 0.5 mm.
- Some heavy storms generate "diamond dust," which consists of very small ice crystals that float in the air.
For more detailed information about rainfall patterns in Capilla del Monte, visit our Rainfall & Precipitation page.
Current rainfall in Capilla del Monte
 3 m/s
3 m/salmost clear and no rain
3 m/salmost clear and no rain
4 m/sclear and no rain


