Monthly Average Rainy days in Cala Murada
The number of days each month with rain, snow and hail in Cala Murada (Balearic Islands), Spain.
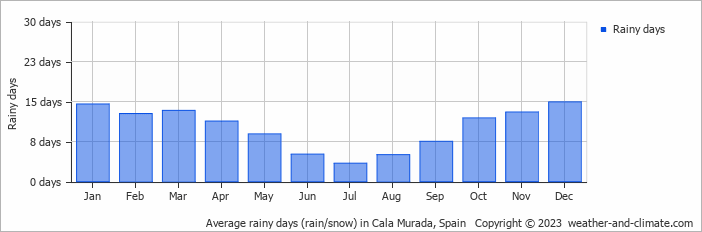
- On average, December is the most rainy with 14 days of rain/snow.
- On average, July is the driest month with 3 rainy days.
- The average annual number of rainy days is 121.
Current rainfall in Cala Murada
Tue Dec 03
19°C | 12°C
NE  11 km/h
11 km/hbroken clouds and no rain
Wed Dec 04
15°C | 11°C
N 25 km/h
25 km/h8.7 mm
partly cloudy and rain
Thu Dec 05
18°C | 10°C
NW 11 km/h
11 km/hpartly cloudy and no rain


