Monthly Average Rainy days in Cajicá
The number of days each month with rain, snow and hail in Cajicá (Cundinamarca), Colombia.
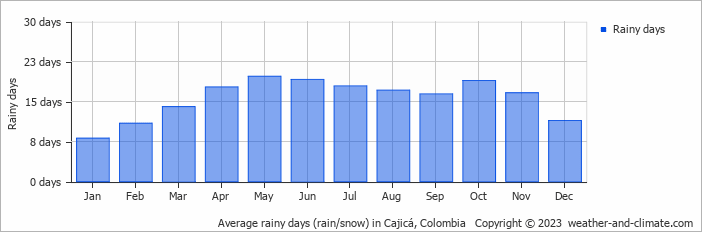
- Most rainy days are in April, May, June, July, August, September, October and November.
- On average, May is the most rainy with 19 days of rain/snow.
- On average, January is the driest month with 8 rainy days.
- The average annual number of rainy days is 187.
Current rainfall in Cajicá
Thu Jan 02
21°C | 7°C
NE  2 m/s
2 m/s
2 m/s1.7 mm
broken clouds and rain
Fri Jan 03
20°C | 9°C
E 2 m/s
2 m/s5 mm
broken clouds and thunder
Sat Jan 04
20°C | 9°C
E 3 m/s
3 m/s0.7 mm
broken clouds and rain


