Average monthly rainy days in Caboolture
The number of days each month with rain, snow and hail in Caboolture (Queensland), Australia.
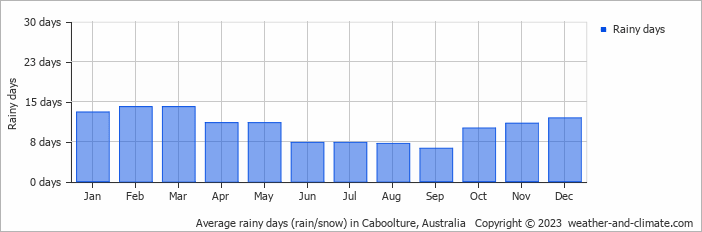
- On average, March is the most rainy with 14 days of rain/snow.
- On average, September is the driest month with 6 rainy days.
- The average annual number of rainy days is 123.
Weather Forecasts for Caboolture
Mon Apr 29
25°C | 15°C
SE  11 km/h
11 km/halmost clear and no rain
Tue Apr 30
25°C | 15°C
SE 7 km/h
7 km/h0.6 mm
partly cloudy and slight rain
Wed May 01
24°C | 14°C
S 14 km/h
14 km/h0.9 mm
partly cloudy and slight rain


