Monthly Average Rainy days in Bucerías
The number of days each month with rain, snow and hail in Bucerías (Riviera Nayarit), Mexico.
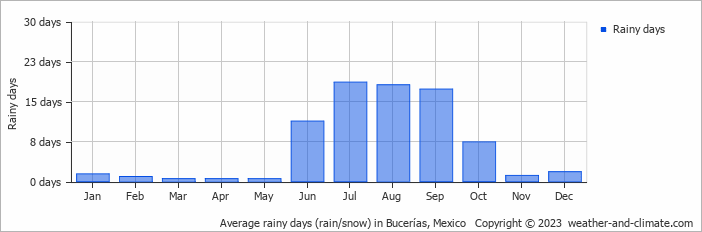
- Most rainy days are in July, August and September.
- Bucerías has dry periods in January, February, March, April, May, November and December.
- On average, July is the most rainy with 18 days of rain/snow.
- On average, May is the driest month with 0 rainy days.
- The average annual number of rainy days is 79.
Current rainfall in Bucerías
Sun Jan 12
24°C | 15°C
S  2 m/s
2 m/s
2 m/sbroken clouds and no rain
Mon Jan 13
25°C | 13°C
S 3 m/s
3 m/sbroken clouds and no rain
Tue Jan 14
26°C | 14°C
SW 2 m/s
2 m/salmost clear and no rain


