Monthly Average Rainy days in Bitung
The number of days each month with rain, snow and hail in Bitung (North Sulawesi), Indonesia.
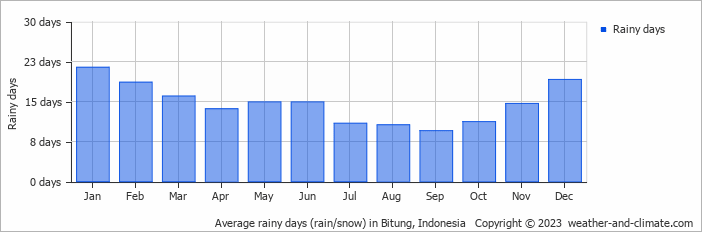
- Most rainy days are in January, February, March and December.
- On average, January is the most rainy with 21 days of rain/snow.
- On average, September is the driest month with 9 rainy days.
- The average annual number of rainy days is 175.
Current rainfall in Bitung
Mon Jan 06
31°C | 22°C
SW  1 m/s
1 m/s
1 m/s2.5 mm
broken clouds and thunder
Tue Jan 07
32°C | 22°C
SE 1 m/s
1 m/s7.7 mm
broken clouds and chance of rain
Wed Jan 08
32°C | 22°C
E 2 m/s
2 m/s21 mm
broken clouds and thunder


