Monthly Average Rainy days in Barra de Tabatinga
The number of days each month with rain, snow and hail in Barra de Tabatinga (Rio Grande do Norte), Brazil.
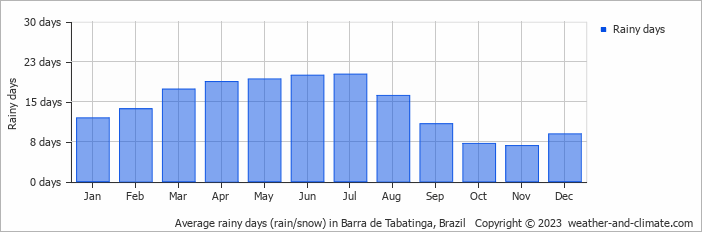
- Most rainy days are in March, April, May, June, July and August.
- On average, July is the most rainy with 20 days of rain/snow.
- On average, November is the driest month with 6 rainy days.
- The average annual number of rainy days is 170.
Current rainfall in Barra de Tabatinga
Tue Jan 07
32°C | 26°C
SE  6 m/s
6 m/s
6 m/s0.5 mm
partly cloudy and chance of slight rain
Wed Jan 08
32°C | 26°C
E 5 m/s
5 m/s0.5 mm
broken clouds and chance of slight rain
Thu Jan 09
32°C | 25°C
E 6 m/s
6 m/s3 mm
broken clouds and rain


