Monthly Average Rainy days in Barra de Camaratuba
The number of days each month with rain, snow and hail in Barra de Camaratuba (Paraíba), Brazil.
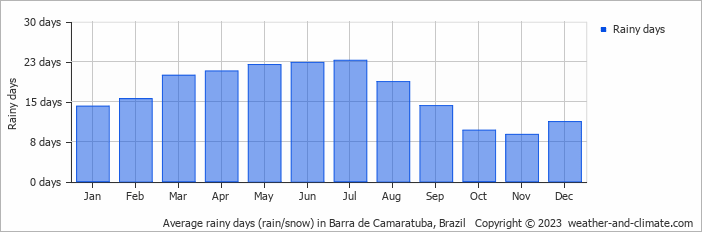
- Most rainy days are in February, March, April, May, June, July and August.
- On average, July is the most rainy with 22 days of rain/snow.
- On average, November is the driest month with 8 rainy days.
- The average annual number of rainy days is 199.
Current rainfall in Barra de Camaratuba
Sun Dec 22
31°C | 24°C
SE  7 m/s
7 m/s
7 m/s1.5 mm
partly cloudy and rain
Mon Dec 23
31°C | 24°C
SE 6 m/s
6 m/s1.2 mm
partly cloudy and chance of slight rain
Tue Dec 24
31°C | 24°C
SE 6 m/s
6 m/s2.1 mm
partly cloudy and slight rain