ClimateForecastAprilMay >>

Average monthly rainy days in Balnarring

The number of days each month with rain, snow and hail in Balnarring (Victoria), Australia.

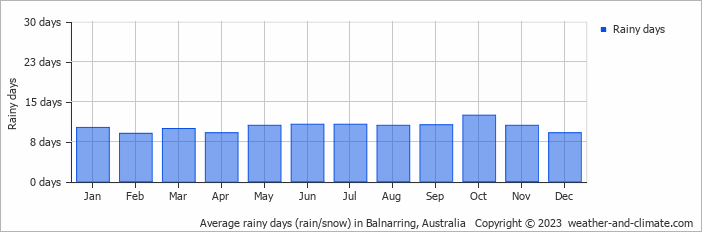
  • On average, October is the most rainy with 12 days of rain/snow.
  • On average, February is the driest month with 9 rainy days.
  • The average annual number of rainy days is 123.

Weather Forecasts for Balnarring

Wed   May 01
17°C | 9°C
S 14 km/h
partly cloudy and no rain

partly cloudy and no rain

Thu   May 02
18°C | 10°C
SE 18 km/h
partly cloudy and no rain

partly cloudy and no rain

Fri   May 03
18°C | 10°C
SE 14 km/h
partly cloudy and no rain

partly cloudy and no rain

Interested in more climate information?

Weather and Climate provides you with all the information you need about the climate in Balnarring.

Our site offers climate and forecast data for every country in the world. Are you going to Australia? On this website you can find historical weather averages for many cities in Australia. Not sure yet where to go? We now have a tool which recommends destinations that suit your ideal climate conditions. Find out where to go with our weather planner.