ClimateForecastSeptemberOctober >>

Monthly Average Rainy days in Whitsunday islands

The number of days each month with rain, snow and hail in Whitsunday islands (Queensland), Australia.

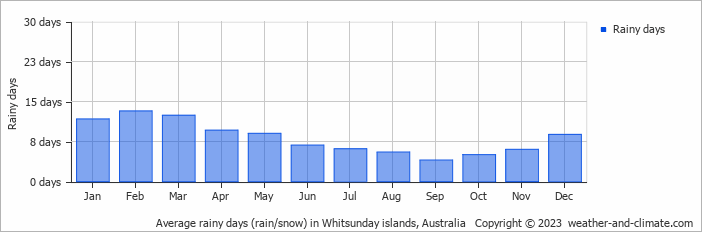
  • On average, February is the most rainy with 13 days of rain/snow.
  • On average, September is the driest month with 4 rainy days.
  • The average annual number of rainy days is 97.

Current rainfall in Whitsunday islands

Sun   Sep 08
24°C | 20°C
SE 25 km/h
0.4 mm
partly cloudy and  chance of slight rain

partly cloudy and chance of slight rain

Mon   Sep 09
24°C | 20°C
E 22 km/h
0.4 mm
partly cloudy and small chance of slight rain

partly cloudy and small chance of slight rain

Tue   Sep 10
25°C | 21°C
SE 25 km/h
almost clear and no rain

almost clear and no rain

Interested in more climate information?

This site provides you with all the information you need about the climate in Whitsunday islands.

Our site offers climate and forecast data for every country in the world. Are you going to Australia? On this website you can find historical weather averages for many cities in Australia. Not sure yet where to go? We now have a tool which recommends destinations that suit your ideal travel conditions. Find out where to go with our weather planner.