Monthly Average Rainy days in San Salvador
The number of days each month with rain, snow and hail in San Salvador (San Salvador), El Salvador.
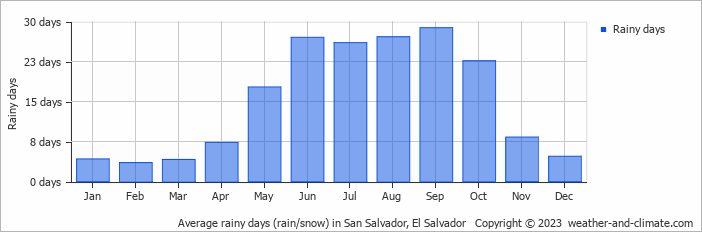
- Most rainy days are in May, June, July, August, September and October.
- On average, September is the most rainy with 28 days of rain/snow.
- On average, February is the driest month with 3 rainy days.
- The average annual number of rainy days is 181.
Current rainfall in San Salvador
Mon Jan 06
30°C | 20°C
N  4 m/s
4 m/s
4 m/s0.7 mm
partly cloudy and small chance of rain
Tue Jan 07
30°C | 20°C
N 5 m/s
5 m/s0.3 mm
partly cloudy and small chance of slight rain
Wed Jan 08
30°C | 19°C
N 5 m/s
5 m/s0.6 mm
partly cloudy and small chance of slight rain


