Monthly Average Rainy days in Quibdó
The number of days each month with rain, snow and hail in Quibdó (Choco), Colombia.
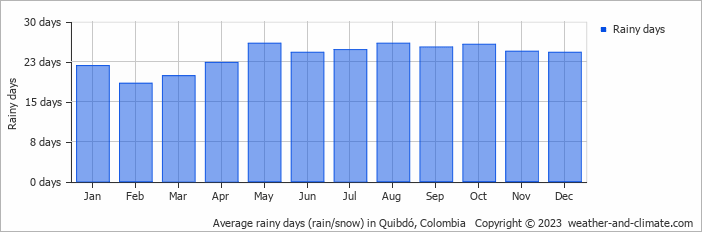
- Most rainy days are in January, February, March, April, May, June, July, August, September, October, November and December.
- On average, May is the most rainy with 25 days of rain/snow.
- On average, February is the driest month with 18 rainy days.
- The average annual number of rainy days is 282.
Current rainfall in Quibdó
Thu Nov 21
29°C | 22°C
S  11 km/h
11 km/h26 mm
broken clouds and thunder
Fri Nov 22
29°C | 22°C
SW 7 km/h
7 km/h18 mm
broken clouds and thunder
Sat Nov 23
31°C | 21°C
S 11 km/h
11 km/h23 mm
broken clouds and thunder


