Monthly Average Rainy days in Pukapuka
The number of days each month with rain, snow and hail in Pukapuka (), the Cook Islands.
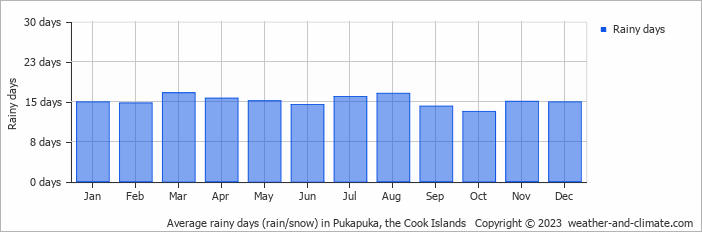
- Most rainy days are in March, April, May, July, August and November.
- On average, March is the most rainy with 16 days of rain/snow.
- On average, October is the driest month with 13 rainy days.
- The average annual number of rainy days is 180.
Current rainfall in Pukapuka
Sat Nov 16
30°C | 25°C
E  22 km/h
22 km/h8.7 mm
broken clouds and rain
Sun Nov 17
31°C | 25°C
E 25 km/h
25 km/h4.5 mm
partly cloudy and rain
Mon Nov 18
30°C | 26°C
E 29 km/h
29 km/h20 mm
broken clouds and thunder