Monthly Average Rainy days in Puerto Carreño
The number of days each month with rain, snow and hail in Puerto Carreño (Vichada Department), Colombia.
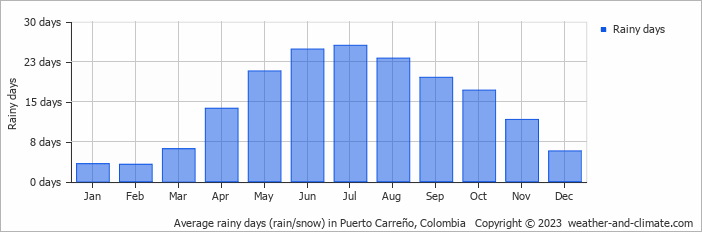
- Most rainy days are in May, June, July, August, September and October.
- On average, July is the most rainy with 25 days of rain/snow.
- On average, February is the driest month with 3 rainy days.
- The average annual number of rainy days is 174.
Current rainfall in Puerto Carreño
Sun Nov 17
33°C | 24°C
SW  7 km/h
7 km/hpartly cloudy and no rain
Mon Nov 18
33°C | 24°C
NE 7 km/h
7 km/h4.6 mm
broken clouds and thunder
Tue Nov 19
33°C | 23°C
NE 11 km/h
11 km/h11 mm
partly cloudy and chance of rain


