Monthly Average Rainy days in Kermadec
The number of days each month with rain, snow and hail in Kermadec (), Kermadec Islands.
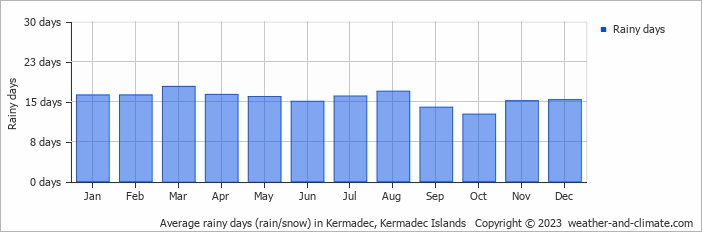
- Most rainy days are in January, February, March, April, May, June, July, August, November and December.
- On average, March is the most rainy with 17 days of rain/snow.
- On average, October is the driest month with 12 rainy days.
- The average annual number of rainy days is 187.
Current rainfall in Kermadec
Wed Dec 04
25°C | 20°C
E  18 km/h
18 km/h0.2 mm
broken clouds and chance of slight rain
Thu Dec 05
25°C | 20°C
NE 14 km/h
14 km/h2.8 mm
broken clouds and rain
Fri Dec 06
25°C | 20°C
NW 14 km/h
14 km/h7.6 mm
overcast and heavy rain


