Average monthly rainy days in Jokulsarlon Glacial Lagoon

The number of days each month with rain, snow and hail in Jokulsarlon Glacial Lagoon (), Iceland.

Average monthly rainy days in Jokulsarlon Glacial Lagoon,

Feel free to add this climate graph to your website. Click the copy button above.

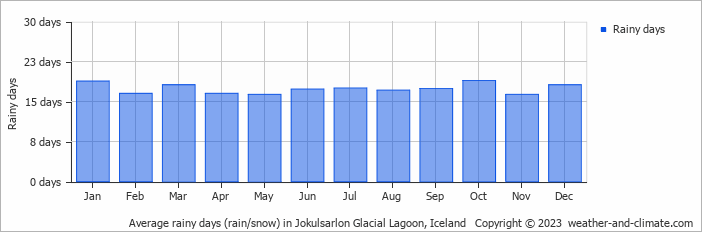
  • Most rainy days are in January, February, March, April, May, June, July, August, September, October, November and December.
  • On average, October is the most rainy with 18 days of rain/snow.
  • On average, May is the driest month with 16 rainy days.
  • The average annual number of rainy days is 208.

Weather Forecasts for Jokulsarlon Glacial Lagoon

Fri   Mar 29
2°C | -2°C
N 25 km/h
overcast and no rain

overcast and no rain

Sat   Mar 30
2°C | -3°C
N 25 km/h
1.6 mm
overcast and slight snow

overcast and slight snow

Sun   Mar 31
1°C | -4°C
N 40 km/h
1.1 mm
overcast and slight rain

overcast and slight rain

Interested in more climate information?

Weather and Climate provides you with all the information you need about the climate in Jokulsarlon Glacial Lagoon.

Our site offers climate and forecast data for every country in the world. Are you going to Iceland? On this website you can find historical weather averages for many cities in Iceland. Not sure yet where to go? We now have a tool which recommends destinations that suit your ideal climate conditions. Find out where to go with our weather planner.