Monthly Average Rainy days in Cabrobó
The number of days each month with rain, snow and hail in Cabrobó (Acre), Brazil.
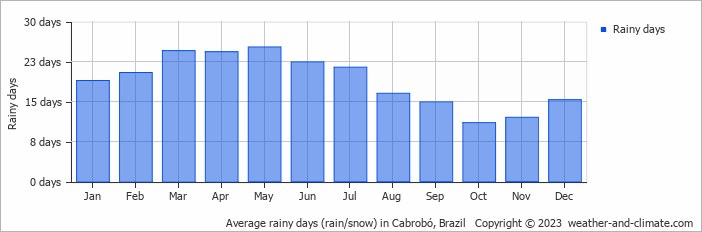
- Most rainy days are in January, February, March, April, May, June, July, August and December.
- On average, May is the most rainy with 25 days of rain/snow.
- On average, October is the driest month with 11 rainy days.
- The average annual number of rainy days is 226.
Current rainfall in Cabrobó
Tue Jan 07
35°C | 24°C
SE  4 m/s
4 m/s
4 m/spartly cloudy and no rain
Wed Jan 08
35°C | 22°C
N 3 m/s
3 m/salmost clear and no rain
Thu Jan 09
35°C | 23°C
NE 3 m/s
3 m/s7.1 mm
broken clouds and chance of slight rain


