Monthly Average Rainy days in Barcelos
The number of days each month with rain, snow and hail in Barcelos (), Brazil.
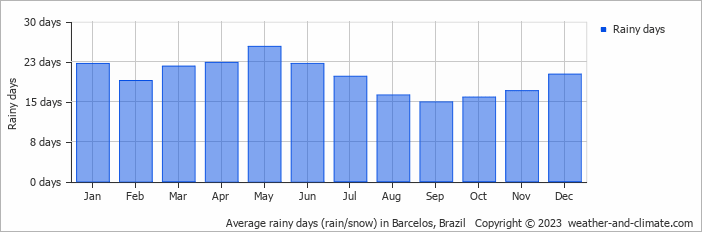
- Most rainy days are in January, February, March, April, May, June, July, August, October, November and December.
- On average, May is the most rainy with 25 days of rain/snow.
- On average, September is the driest month with 14 rainy days.
- The average annual number of rainy days is 236.
Current rainfall in Barcelos
Tue Dec 31
31°C | 24°C
E  3 m/s
3 m/s
3 m/s18 mm
broken clouds and thunder
Wed Jan 01
30°C | 24°C
NE 3 m/s
3 m/s10 mm
broken clouds and thunder
Thu Jan 02
29°C | 24°C
E 2 m/s
2 m/s10 mm
broken clouds and thunder